|
To
make the "m" column, I first typed the "0", then in the
next box down typed "=1+A4", and hit enter. Then after selecting
and copying the A5 box, I selected a long column below A5 and hit paste.
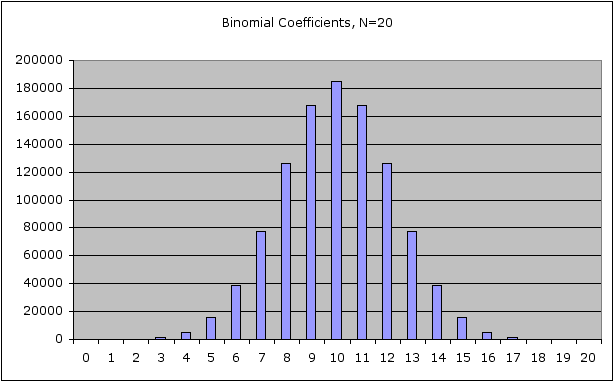
To make the C(20,m) column I used the COMBIN(N,M) function. I typed "=COMBIN(20,A4)" in the B4 Box, and then again copied that, selected B5:B24, and did a paste. Finally, I selected the coefficients and used the "Chart Wizard" to make the plot. I set the A4:A24 column as the X labels. |