Problem 1
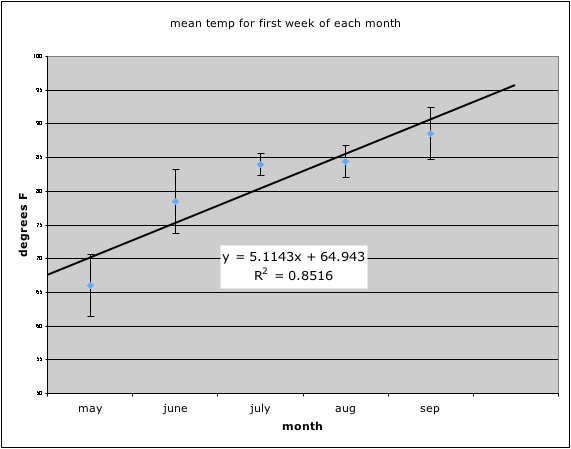
ANOVA says: At least one of the columns is different (p=8e-4).
(Null hypothesis: all column means are same.)

CORRELATION says: There is a positive correlation; p=0.025.

GRAPH: below. The line isn't a great fit to the data, but there
is clearly an overall upward trend over time. The error bars
are 95% confidence based on each column's variance and N.
date may june july aug sep
1 67 78 84 81 91
2 72 74 85 81 92
3 74 67 81 82 93
4 62 84 84 86 93
5 56 85 83 85 87
6 66 79 83 87 84
7 65 82 88 89 80
Anova: Single Factor
r 0.922815279
SUMMARY r_err 0.222419993
Groups Count Sum Average Variance p-value 0.025441212
may 7 462 66 36.33333333
june 7 549 78.42857143 39.61904762 T = A * month + B
july 7 588 84 4.666666667 A 5.114285714
aug 7 591 84.42857143 9.952380952 B 44.48571429
sep 7 620 88.57142857 25.61904762
ANOVA
Source of Variation SS df MS F P-value F crit
Between Groups 2150 4 537.5 23.13012295 8.40524E-09 2.689627574
Within Groups 697.1428571 30 23.23809524
Total 2847.142857 34        
descriptive statistics may june july aug sep
5 6 7 8 9
Mean 66 78.42857143 84 84.42857143 88.57142857
Standard Error 2.27826166 2.379046857 0.816496581 1.192379431 1.913077088
Median 66 79 84 85 91
Mode #N/A #N/A 84 81 93
Standard Deviation 6.027713773 6.29436634 2.160246899 3.154739443 5.061526214
Sample Variance 36.33333333 39.61904762 4.666666667 9.952380952 25.61904762
Kurtosis 0.132362596 0.675495793 1.885714286 -1.641212426 -0.577288871
Skewness -0.357979534 -1.007883883 0.83323809 0.161070028 -0.901178438
Range 18 18 7 8 13
Minimum 56 67 81 81 80
Maximum 74 85 88 89 93
Sum 462 549 588 591 620
Count 7 7 7 7 7
Confidence Level(95.0%) 5.574705445 5.821317936 1.997895156 2.917647355 4.68113099
2* stnd error 4.55652332 4.758093713 1.632993162 2.384758862 3.826154176
graph error bars are 2 * stnd error
which is about 95% confidence for each mean