|
|
|
|
|
|
|
In
pairs :
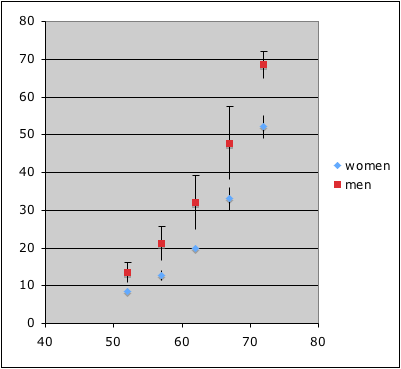
age/sex : BOTH signicant; no interaction
age/place: only age significant
sex/place: NEITHER significant
So: age is a strong factor;
sex is somewhat of a factor, when broken
out by age.
|
|
Problem
2
which of these factors are significant ?
Alone:
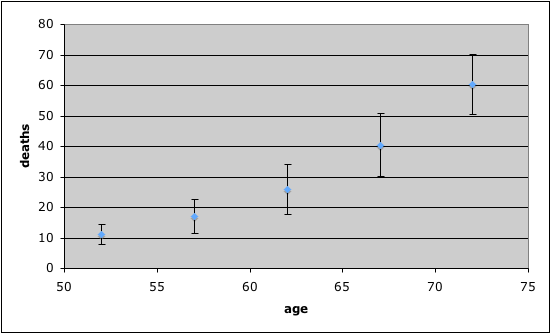
Age: YES (just look at the graph)
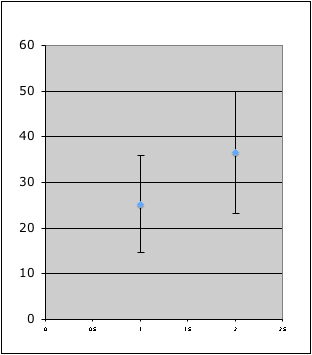
Sex: no, not alone (student's t; look at 95% bars on graph)
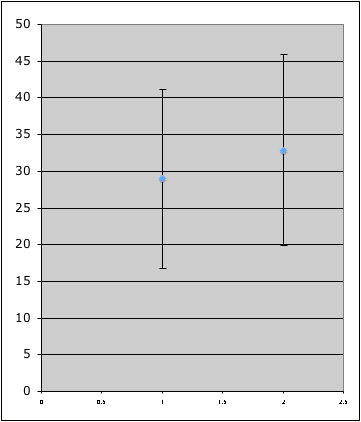
Place: no, not alone (just look at graph)
|
|
|
|
|
|
|
|
|
|
|
|
|
|
|
|
|
|
|
|
|
|
|
|
|
|
|
|
|
|
|
|
|
|
|
|
|
|
|
|
|
|
|
|
|
|
|
|
|
|
|
|
|
|
|
|
|
|
|
|
|
|
|
|
|
|
|
|
|
|
|
|
|
|
|
|
|
|
|
|
|
|
|
|
|
|
|
|
|
|
|
|
|
|
|
|
|
|
|
|
|
|
|
|
|
|
|
|
|
|
|
|
|
|
|
|
|
|
|
|
|
|
|
|
|
|
|
|
|
|
|
|
|
|
|
|
|
|
|
|
|
|
|
|
|
|
|
|
|
|
|
|
|
|
|
|
|
|
|
|
|
|
|
|
|
|
|
|
|
|
|
|
|
|
|
|
|
|
|
|
|
|
|
|
|
|
|
|
|
|
|
|
|
|
|
|
|
|
|
|
|
|
|
|
|
|
|
|
|
|
|
|
|
|
|
|
|
|
|
|
|
|
|
|
|
|
|
|
|
|
|
|
|
|
|
|
|
|
|
|
|
|
|
|
|
|
|
|
|
|
|
|
|
|
|
|
|
|
|
|
|
|
|
|
|
|
|
|
|
|
|
|
|
|
|
|
|
|
|
|
|
|
|
|
|
|
|
|
|
|
|
|
|
|
|
|
|
|
|
|
|
|
|
|
|
|
|
|
|
|
|
|
|
|
|
|
|
|
|
|
|
|
|
|
|
|
|
|
|
|
|
|
|
|
|
|
|
|
|
|
|
sex |
where |
age |
deaths per 100 |
age |
sex |
where |
|
|
rearrange to do 2-factor ANOVA, ignoring urban/rural : |
|
|
|
|
|
|
|
|
|
|
|
femaie |
rural |
50-54 |
8.7 |
|
52 |
male |
rural |
|
|
|
|
|
|
|
|
|
|
52 |
57 |
62 |
67 |
72 |
|
|
|
femaie |
urban |
50-54 |
8.4 |
|
57 |
female |
urban |
|
|
|
50-54 |
55-59 |
60-64 |
65-69 |
70-74 |
|
|
|
|
|
|
|
|
|
|
male |
rural |
50-54 |
11.7 |
|
62 |
|
|
|
|
female |
8.7 |
11.7 |
20.3 |
30.9 |
54.3 |
|
|
8.55 |
12.65 |
19.8 |
33 |
52.15 |
|
|
|
male |
urban |
50-54 |
15.4 |
|
67 |
|
|
|
|
|
8.4 |
13.6 |
19.3 |
35.1 |
50 |
|
|
0.212132034 |
1.343502884 |
0.707106781 |
2.969848481 |
3.040559159 |
|
|
|
female |
rural |
55-59 |
11.7 |
|
72 |
|
|
|
|
male |
11.7 |
18.1 |
26.9 |
41 |
66 |
|
|
13.55 |
21.2 |
31.95 |
47.8 |
68.55 |
|
|
|
female |
urban |
55-59 |
13.6 |
|
|
|
|
|
|
|
15.4 |
24.3 |
37 |
54.6 |
71.1 |
|
|
2.61629509 |
4.384062043 |
7.14177849 |
9.616652224 |
3.606244584 |
|
|
|
male |
rural |
55-59 |
18.1 |
|
|
|
|
|
|
|
|
|
|
|
|
|
|
|
|
|
|
|
|
|
|
male |
urban |
55-59 |
24.3 |
|
|
|
|
|
|
|
|
|
|
|
|
|
|
|
|
|
female |
rural |
60-64 |
20.3 |
|
|
|
|
|
|
Anova: Two-Factor With Replication |
|
|
|
|
|
|
|
female |
urban |
60-64 |
19.3 |
|
1940 Virginia deaths per 100 |
|
|
|
|
|
|
|
|
|
|
|
|
male |
rural |
60-64 |
26.9 |
|
|
|
|
|
|
SUMMARY |
50-54 |
55-59 |
60-64 |
65-69 |
70-74 |
Total |
|
|
|
male |
urban |
60-64 |
37 |
|
|
|
|
|
|
female |
|
|
|
|
|
|
|
|
|
female |
rural |
65-69 |
30.9 |
|
|
|
|
|
|
Count |
2 |
2 |
2 |
2 |
2 |
10 |
|
|
|
female |
urban |
65-69 |
35.1 |
|
|
|
|
|
|
Sum |
17.1 |
25.3 |
39.6 |
66 |
104.3 |
252.3 |
|
|
|
male |
rural |
65-69 |
41 |
|
|
|
|
|
|
Average |
8.55 |
12.65 |
19.8 |
33 |
52.15 |
25.23 |
|
|
|
male |
urban |
65-69 |
54.6 |
|
|
|
|
|
|
Variance |
0.045 |
1.805 |
0.5 |
8.82 |
9.245 |
280.2734444 |
|
|
|
female |
rural |
70-74 |
54.3 |
|
|
|
|
|
|
|
|
|
|
|
|
|
|
|
|
female |
urban |
70-74 |
50 |
|
|
|
|
|
|
male |
|
|
|
|
|
|
|
|
|
male |
rural |
70-74 |
66 |
|
|
|
|
|
|
Count |
2 |
2 |
2 |
2 |
2 |
10 |
|
|
|
male |
urban |
70-74 |
71.1 |
|
|
|
|
|
|
Sum |
27.1 |
42.4 |
63.9 |
95.6 |
137.1 |
366.1 |
|
|
|
|
|
|
|
|
|
|
|
|
|
Average |
13.55 |
21.2 |
31.95 |
47.8 |
68.55 |
36.61 |
|
|
|
|
|
|
|
|
|
|
|
|
|
Variance |
6.845 |
19.22 |
51.005 |
92.48 |
13.005 |
450.5787778 |
|
|
|
|
|
|
|
|
|
|
|
|
|
|
|
|
|
|
|
|
|
|
by age alone : |
|
|
|
|
|
|
|
|
|
Total |
|
|
|
|
|
|
|
|
|
50-54 |
55-59 |
60-64 |
65-69 |
70-74 |
|
|
|
|
|
Count |
4 |
4 |
4 |
4 |
4 |
|
|
|
|
8.7 |
11.7 |
20.3 |
30.9 |
54.3 |
|
|
|
|
|
Sum |
44.2 |
67.7 |
103.5 |
161.6 |
241.4 |
|
|
|
|
8.4 |
13.6 |
19.3 |
35.1 |
50 |
|
|
|
|
|
Average |
11.05 |
16.925 |
25.875 |
40.4 |
60.35 |
|
|
|
|
11.7 |
18.1 |
26.9 |
41 |
66 |
|
|
|
|
|
Variance |
10.63 |
31.37583333 |
66.37583333 |
106.78 |
97.07 |
|
|
|
|
15.4 |
24.3 |
37 |
54.6 |
71.1 |
|
|
|
|
|
|
|
|
|
|
|
|
|
|
|
|
|
|
|
|
|
|
|
|
|
|
|
|
|
|
|
|
|
|
|
50-54 |
55-59 |
60-64 |
65-69 |
70-74 |
|
|
|
|
|
ANOVA |
|
|
|
|
|
|
|
|
|
|
|
|
|
|
|
|
|
|
|
Source of Variation |
SS |
df |
MS |
F |
P-value |
F crit |
|
|
Mean |
11.05 |
16.925 |
25.875 |
40.4 |
60.35 |
|
|
|
|
|
Sample |
647.522 |
1 |
647.522 |
31.9023501 |
0.000212978 |
4.964602701 |
|
|
Standard Error |
1.630184039 |
2.800706756 |
4.073568256 |
5.16672043 |
4.926205436 |
|
|
|
|
|
Columns |
6288.497 |
4 |
1572.12425 |
77.45599103 |
1.74635E-07 |
3.478049691 |
|
|
Median |
10.2 |
15.85 |
23.6 |
38.05 |
60.15 |
|
|
|
|
|
Interaction |
86.203 |
4 |
21.55075 |
1.061770212 |
0.424285994 |
3.478049691 |
|
|
Standard Deviation |
3.260368077 |
5.601413512 |
8.147136511 |
10.33344086 |
9.852410872 |
|
|
|
|
|
Within |
202.97 |
10 |
20.297 |
|
|
|
|
|
Sample Variance |
10.63 |
31.37583333 |
66.37583333 |
106.78 |
97.07 |
|
|
|
|
|
|
|
|
|
|
|
|
|
|
|
|
|
|
|
|
Count |
4 |
4 |
4 |
4 |
4 |
|
|
|
|
|
Total |
7225.192 |
19 |
|
|
|
|
|
|
|
|
|
|
|
|
Confidence Level(95.0%) |
5.18797317 |
8.913098867 |
12.96391224 |
16.44281034 |
15.67738429 |
|
|
|
|
|
|
|
|
|
|
|
|
|
|
|
|
|
|
|
|
2 * std error |
3.260368077 |
5.601413512 |
8.147136511 |
10.33344086 |
9.852410872 |
|
|
|
|
|
|
|
|
|
|
|
|
|
|
|
|
|
|
|
|
|
|
|
|
|
|
|
|
|
|
|
So, BOTH Age and Sex are significant factors in 2-way. |
|
|
|
|
|
|
|
|
|
|
|
|
|
|
|
|
|
|
|
|
|
No interaction to speak of |
|
|
|
|
|
|
|
|
|
|
|
|
|
|
|
|
|
|
|
|
|
|
|
|
|
|
|
|
|
|
|
|
|
|
|
|
|
|
|
|
|
|
|
|
|
|
|
|
|
|
|
|
|
|
|
|
|
|
|
|
|
|
|
|
|
|
|
|
|
|
|
|
|
|
|
|
|
|
|
|
|
|
|
|
|
|
|
|
|
|
|
|
|
|
|
|
|
|
|
|
|
|
|
|
|
|
|
|
|
|
|
|
|
|
|
|
|
|
|
|
|
|
|
|
|
|
|
|
rearrange to do 2-factor ANOVA, ignoring sex : |
|
|
|
|
|
|
|
|
|
|
|
|
|
|
|
|
|
|
|
|
|
|
|
|
|
|
|
|
|
|
|
|
|
|
|
|
|
|
|
|
|
|
|
|
|
|
|
|
|
|
|
|
|
|
|
|
|
|
|
|
|
|
|
|
|
|
|
|
|
|
|
|
|
|
|
50-54 |
55-59 |
60-64 |
65-69 |
70-74 |
|
|
|
|
|
|
|
|
|
|
|
|
|
|
|
|
|
|
|
|
rural |
8.7 |
11.7 |
20.3 |
30.9 |
54.3 |
|
|
|
|
|
|
|
|
|
|
|
|
|
|
|
|
|
|
|
|
rural |
11.7 |
18.1 |
26.9 |
41 |
66 |
|
|
|
|
|
|
|
|
|
|
|
|
|
|
|
|
|
|
|
|
urban |
8.4 |
13.6 |
19.3 |
35.1 |
50 |
|
|
|
|
|
|
|
|
|
|
|
|
|
|
|
|
|
|
|
|
urban |
15.4 |
24.3 |
37 |
54.6 |
71.1 |
|
|
|
|
|
|
|
|
|
|
|
|
|
|
|
|
|
|
|
|
|
|
|
|
|
|
|
|
|
|
|
|
|
|
|
|
|
|
|
|
|
|
|
|
|
|
|
|
|
|
|
|
|
|
|
|
|
|
|
|
|
|
|
|
|
|
|
|
|
|
|
|
Anova: Two-Factor With Replication |
|
|
|
|
|
|
|
|
|
|
|
|
|
|
|
|
|
|
|
|
|
|
|
|
|
|
|
|
|
|
|
|
|
|
|
|
|
|
|
|
|
|
|
|
|
|
|
|
|
SUMMARY |
50-54 |
55-59 |
60-64 |
65-69 |
70-74 |
Total |
|
|
|
|
|
|
|
|
|
|
|
|
|
|
|
|
|
|
|
rural |
|
|
|
|
|
|
|
|
|
|
|
|
|
|
|
|
|
|
|
|
|
|
|
|
|
Count |
2 |
2 |
2 |
2 |
2 |
10 |
|
|
|
|
|
|
|
|
|
|
|
|
|
|
|
|
|
|
|
Sum |
20.4 |
29.8 |
47.2 |
71.9 |
120.3 |
289.6 |
|
|
|
|
|
|
|
|
|
|
|
|
|
|
|
|
|
|
|
Average |
10.2 |
14.9 |
23.6 |
35.95 |
60.15 |
28.96 |
|
|
|
|
|
|
|
|
|
|
|
|
|
|
|
|
|
|
|
Variance |
4.5 |
20.48 |
21.78 |
51.005 |
68.445 |
374.0293333 |
|
|
|
|
|
|
|
|
|
|
|
|
|
|
|
|
|
|
|
|
|
|
|
|
|
|
|
|
|
|
|
|
|
|
|
|
|
|
|
|
|
|
|
|
|
urban |
|
|
|
|
|
|
|
|
|
|
|
|
|
|
|
|
|
|
|
|
|
|
|
|
|
Count |
2 |
2 |
2 |
2 |
2 |
10 |
|
|
|
|
|
|
|
|
|
|
|
|
|
|
|
|
|
|
|
Sum |
23.8 |
37.9 |
56.3 |
89.7 |
121.1 |
328.8 |
|
|
|
|
|
|
|
|
|
|
|
|
|
|
|
|
|
|
|
Average |
11.9 |
18.95 |
28.15 |
44.85 |
60.55 |
32.88 |
|
|
|
|
|
|
|
|
|
|
|
|
|
|
|
|
|
|
|
Variance |
24.5 |
57.245 |
156.645 |
190.125 |
222.605 |
420.2328889 |
|
|
|
|
|
|
|
|
by sex alone : |
female |
male |
|
|
|
|
|
|
|
|
|
|
|
|
|
|
|
|
|
|
|
|
|
|
|
|
8.7 |
11.7 |
|
|
|
|
|
|
|
Total |
|
|
|
|
|
|
|
|
|
|
|
|
|
|
|
|
8.4 |
15.4 |
|
|
|
|
|
|
|
Count |
4 |
4 |
4 |
4 |
4 |
|
|
|
|
|
|
|
|
|
|
|
11.7 |
18.1 |
|
|
|
|
|
|
|
Sum |
44.2 |
67.7 |
103.5 |
161.6 |
241.4 |
|
|
|
|
|
|
|
|
|
|
|
13.6 |
24.3 |
|
|
|
|
|
|
|
Average |
11.05 |
16.925 |
25.875 |
40.4 |
60.35 |
|
|
|
|
|
|
|
|
|
|
|
20.3 |
26.9 |
|
|
|
|
|
|
|
Variance |
10.63 |
31.37583333 |
66.37583333 |
106.78 |
97.07 |
|
|
|
|
|
|
|
|
|
|
|
19.3 |
37 |
|
|
|
|
|
|
|
|
|
|
|
|
|
|
|
|
|
|
|
|
|
|
|
|
30.9 |
41 |
|
|
|
|
|
|
|
|
|
|
|
|
|
|
|
|
|
|
|
|
|
|
|
|
35.1 |
54.6 |
|
|
|
|
|
|
|
ANOVA |
|
|
|
|
|
|
|
|
|
|
|
|
|
|
|
|
54.3 |
66 |
|
|
|
|
|
|
|
Source of Variation |
SS |
df |
MS |
F |
P-value |
F crit |
|
|
|
|
|
|
|
|
|
|
50 |
71.1 |
|
|
|
|
|
|
|
Sample |
76.832 |
1 |
76.832 |
0.94003646 |
0.355133865 |
4.964602701 |
|
|
|
|
|
|
|
|
|
|
|
|
|
|
|
|
|
|
|
Columns |
6288.497 |
4 |
1572.12425 |
19.23487759 |
0.000109221 |
3.478049691 |
|
|
|
|
|
|
|
|
|
mean |
25.23 |
36.61 |
|
|
|
|
|
|
|
Interaction |
42.533 |
4 |
10.63325 |
0.13009739 |
0.967877221 |
3.478049691 |
|
|
|
|
|
|
|
|
|
n |
10 |
10 |
|
|
|
|
|
|
|
Within |
817.33 |
10 |
81.733 |
|
|
|
|
|
|
|
|
|
|
|
|
stnd dev |
16.74136925 |
21.22684097 |
|
|
|
|
|
|
|
|
|
|
|
|
|
|
|
|
|
|
|
|
|
|
|
st error |
5.294085799 |
6.712516501 |
|
|
|
|
|
|
|
Total |
7225.192 |
19 |
|
|
|
|
|
|
|
|
|
|
|
|
|
2* std error |
10.5881716 |
13.425033 |
|
|
|
|
|
|
|
|
|
|
|
|
|
|
|
|
|
|
|
|
|
|
|
|
|
|
|
|
|
|
|
|
|
|
|
|
|
|
|
|
|
|
|
|
|
|
|
|
|
combined sigma |
27.03427865 |
|
|
|
|
|
|
|
|
|
|
|
|
|
|
|
|
|
|
|
|
|
|
|
t |
|
0.420947056 |
|
|
|
|
|
|
|
So, place is NOT signifanct in 2-way with age;
neither is there an interaction |
|
|
|
|
|
|
|
|
|
|
stud-t p-val |
|
0.342437345 |
|
|
|
|
|
|
|
|
|
|
|
|
|
|
|
|
|
|
|
|
|
|
|
|
|
|
|
|
|
|
|
|
|
|
|
|
|
|
|
|
|
|
|
|
|
|
|
|
|
|
|
|
|
|
|
|
|
|
|
re arrange to do sex - place 2 factor : |
|
|
|
|
|
|
|
|
|
|
|
|
|
|
|
|
|
|
|
|
|
|
|
|
|
|
|
|
|
|
|
|
|
|
|
|
|
|
|
|
|
|
|
|
|
|
|
|
|
|
|
|
male |
female |
|
|
|
|
|
|
|
|
|
|
|
|
|
|
|
|
|
|
|
|
|
|
|
urban |
15.4 |
8.4 |
|
|
|
|
|
|
|
|
|
|
|
|
|
|
|
|
|
|
|
|
|
|
|
urban |
24.3 |
13.6 |
|
|
|
|
|
|
|
|
|
|
|
|
|
|
|
|
|
|
|
|
|
|
|
urban |
37 |
19.3 |
|
|
|
|
|
|
|
|
|
|
by place alone : |
|
|
|
|
|
|
|
|
|
|
|
urban |
54.6 |
35.1 |
|
|
|
|
|
|
|
|
|
|
|
|
rural |
urban |
|
|
|
|
|
|
|
|
|
urban |
71.1 |
50 |
|
|
|
|
|
|
|
|
|
|
|
|
8.7 |
8.4 |
|
|
|
|
|
|
|
|
|
rural |
11.7 |
8.7 |
|
|
|
|
|
|
|
|
|
|
|
|
11.7 |
15.4 |
|
|
|
|
|
|
|
|
|
rural |
18.1 |
11.7 |
|
|
|
|
|
|
|
|
|
|
|
|
11.7 |
13.6 |
|
|
|
|
|
|
|
|
|
rural |
26.9 |
20.3 |
|
|
|
|
|
|
|
|
|
|
|
|
18.1 |
24.3 |
|
|
|
|
|
|
|
|
|
rural |
41 |
30.9 |
|
|
|
|
|
|
|
|
|
|
|
|
20.3 |
19.3 |
|
|
|
|
|
|
|
|
|
rural |
66 |
54.3 |
|
|
|
|
|
|
|
|
|
|
|
|
26.9 |
37 |
|
|
|
|
|
|
|
|
|
|
|
|
|
|
|
|
|
|
|
|
|
|
|
|
30.9 |
35.1 |
|
|
|
|
|
|
|
Anova: Two-Factor With Replication |
|
|
|
|
|
|
|
|
|
|
|
|
|
|
41 |
54.6 |
|
|
|
|
|
|
|
|
|
|
|
|
|
|
|
|
|
|
|
|
|
|
|
|
54.3 |
50 |
|
|
|
|
|
|
|
SUMMARY |
male |
female |
Total |
|
|
|
|
|
|
|
|
|
|
|
|
|
66 |
71.1 |
|
|
|
|
|
|
|
urban |
|
|
|
|
|
|
|
|
|
|
|
|
|
|
|
|
|
|
|
|
|
|
|
|
|
Count |
5 |
5 |
10 |
|
|
|
|
|
|
|
|
|
|
|
|
mean |
28.96 |
32.88 |
|
|
|
|
|
|
|
Sum |
202.4 |
126.4 |
328.8 |
|
|
|
|
|
|
|
|
|
|
|
|
n |
10 |
10 |
|
|
|
|
|
|
|
Average |
40.48 |
25.28 |
32.88 |
|
|
|
|
|
|
|
|
|
|
|
|
stnd dev |
19.33983799 |
20.49958265 |
|
|
|
|
|
|
|
Variance |
509.967 |
291.157 |
420.2328889 |
|
|
|
|
|
|
|
|
|
|
|
|
st error |
6.115793762 |
6.482537226 |
|
|
|
|
|
|
|
|
|
|
|
|
|
|
|
|
|
|
|
|
|
|
|
2* std error |
12.23158752 |
12.96507445 |
|
|
|
|
|
|
|
rural |
|
|
|
|
|
|
|
|
|
|
|
|
|
|
|
|
|
|
|
|
|
|
|
|
|
Count |
5 |
5 |
10 |
|
|
|
|
|
|
|
|
|
|
|
|
|
|
|
|
|
|
|
|
|
|
Sum |
163.7 |
125.9 |
289.6 |
|
|
|
|
|
|
|
|
|
|
|
|
|
|
|
|
|
|
|
|
|
|
Average |
32.74 |
25.18 |
28.96 |
|
|
|
|
|
|
|
|
|
|
|
|
|
|
|
|
|
|
|
|
|
|
Variance |
466.393 |
339.452 |
374.0293333 |
|
|
|
|
|
|
|
|
|
|
|
|
|
|
|
|
|
|
|
|
|
|
|
|
|
|
|
|
|
|
|
|
|
|
|
|
|
|
|
|
|
|
|
|
|
|
|
|
Total |
|
|
|
|
|
|
|
|
|
|
|
|
|
|
|
|
|
|
|
|
|
|
|
|
|
Count |
10 |
10 |
|
|
|
|
|
|
|
|
|
|
|
|
|
|
|
|
|
|
|
|
|
|
|
Sum |
366.1 |
252.3 |
|
|
|
|
|
|
|
|
|
|
|
|
|
|
|
|
|
|
|
|
|
|
|
Average |
36.61 |
25.23 |
|
|
|
|
|
|
|
|
|
|
|
|
|
|
|
|
|
|
|
|
|
|
|
Variance |
450.5787778 |
280.2734444 |
|
|
|
|
|
|
|
|
|
|
|
|
|
|
|
|
|
|
|
|
|
|
|
|
|
|
|
|
|
|
|
|
|
|
|
|
|
|
|
|
|
|
|
|
|
|
|
|
|
|
|
|
|
|
|
|
|
|
|
|
|
|
|
|
|
|
|
|
|
|
|
|
|
|
|
ANOVA |
|
|
|
|
|
|
|
|
|
|
|
|
|
|
|
|
|
|
|
|
|
|
|
|
|
Source of Variation |
SS |
df |
MS |
F |
P-value |
F crit |
|
|
|
|
|
|
|
|
|
|
|
|
|
|
|
|
|
|
|
Sample |
76.832 |
1 |
76.832 |
0.191247 |
0.667726109 |
4.493998418 |
|
|
|
|
|
|
|
|
|
|
|
|
|
|
|
|
|
|
|
Columns |
647.522 |
1 |
647.522 |
1.61178467 |
0.222396828 |
4.493998418 |
|
|
|
|
|
|
|
|
|
|
|
|
|
|
|
|
|
|
|
Interaction |
72.962 |
1 |
72.962 |
0.181613958 |
0.675667759 |
4.493998418 |
|
|
|
|
|
|
|
|
|
|
|
|
|
|
|
|
|
|
|
Within |
6427.876 |
16 |
401.74225 |
|
|
|
|
|
|
|
|
|
|
|
|
|
|
|
|
|
|
|
|
|
|
|
|
|
|
|
|
|
|
|
|
|
|
|
|
|
|
|
|
|
|
|
|
|
|
|
|
Total |
7225.192 |
19 |
|
|
|
|
|
|
|
|
|
|
|
|
|
|
|
|
|
|
|
|
|
|
|
|
|
|
|
|
|
|
|
|
|
|
|
|
|
|
|
|
|
|
|
|
|
|
|
|
|
|
|
|
|
|
|
|
|
|
|
|
|
|
|
|
|
|
|
|
|
|
|
|
|
|
|
nothing is significant here |
|
|
|
|
|
|
|
|
|
|
|
|
|
|
|
|
|
|
|
|
|
|
|
|
|
|
|
|
|
|
|
|
|
|
|
|
|
|