jims results
Measuring some dishonest dice probabilities
... and thinking about their implications for playing craps.
intro
There were three sets of dice (A, B, C) to be analyzed. We saw
in class that "C" was suspicious, with "A" and "B" looking normal.
The plot (which I made in Excel; you can see the raw data in the .xls file
in this directory or
here as html)
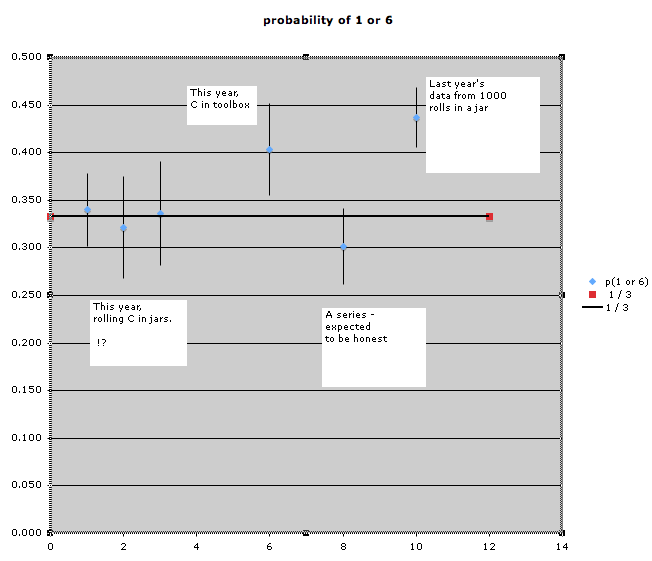
summarizes what I found for the "C" dice, using several
different approaches to "rolling" them. Also on the plot on
the far right are my results from last year.
What I got this year surprised me. I tried to be thorough by rolling
'em several different ways, expecting that all would give me the same
results - but they didn't.
I also see now that I wasn't thorough enough in writing down last year
exactly what I did. In particular, although I recorded how many 1's
and 6's I got from rolling 10 dice, and although I know that I rolled
them in batches, I'm not sure now *how many* dice I put into one of
the bottles at once. I'm guessing that it makes a difference, and
that the "larger area is more likely" doesn't apply when the dice get
too crowded.
taking the data
This year I rolled 6 dice at once in 3 different jars. The idea was
to get a rolling technique that was quick, simple, and didn't require
picking up the dice each time - I left the lid on the jar, shook it,
and then turned it upside down, and counted how many of the dice were
1 or 6 as they lay in the cap. Once complication was that fitting all
six in the cap was possible but not automatic; I often had to shuffle
the jar back and forth to get all six to lie flat in the cap.
Also, the jar with the yellow cap broke part way through - the force
of the dice rolling cracked the glass.
I also rolled the six in an more typical way, cupping them in my hands,
shaking them to mix 'em up, then tossing them into an empty plastic
toolbox (to keep them from rolling off the table) so they'd bounce off
a "back wall" like at a gaming table.
                                     mean p(1 or 6)    2 σ         N dice
 glass jar (brown cap)               0.340             0.038           600
 glass jar (yellow cap)              0.322             0.054           258
 glass jar (blue cap)                0.336             0.054           342
 plastic toolbox                     0.403             0.049           300
 2005 data (blue cap -               0.437             0.032          1000
            five dice per roll ? )
analysis
To illustrate the procedure for generating these numbers, I'll use the
first "brown cap" data.
The raw data is "how many 1's or 6's with 6 dice" = (2, 2, 1, 1, ... )
for 100 total rolls. Then for these numbers,
mean = 2.040, s = 1.154 (using "(n-1) best estimate" standard dev)
Then p = 2.040/6 = 0.340.
To get 2 σ, the 95% confidence range of that p, the formula is
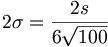
where (a) we divide by 6 dice to convert "how many 1's or 6's"
to a probability fraction, and
(b) we divide by sqrt(100) because we want the variation in the
average of the 100 data points. (That's the 1/sqrt(N) I've been
emphasizing.)
The surprise is that rolling six dice in the jars gave results
consistent with completely honest dice - not at all what I expected,
or what I got last year. I think the difference is that last year I
rolled fewer dice in a single roll in the jars, giving them more room
to in the cap - but since I didn't record my procedure last year, and
since I haven't tested that idea, I guess for now it'll just remain a
guess.
In particular, the 1st set of "brown cap" data and the 2005 data are
significantly different.
(Warning what follows is my convincing
myself that the difference is statistically significant. Unless you've
taken a statistics course, it may not make all that much sense.
That's OK; when/if you need to this sort of stuff for your own experiments,
ask someone. All I'm really doing is looking at how far apart the
data points are, and whether "outside the error bars" means that they
really are different.)
Subtracting the means and combining the σ's gives
x = Δp = 0.437 − 0.340 = 0.097
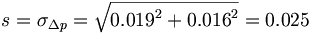 so z = x/s = 3.88 (z is normal with mean=0 and stdev=1)
A value that extreme happens by random chance only this fraction :
2*(1-NORMSDIST(3.88)) = 0.000105 of the time. Not likely.
I did my numeric work in Excel, using expressions like
"=AVERAGE(C21:C120)" as cell formulas. Here "=" at the front
means "put this formula into this box", and the C21:C120 indicate
a range of data cells where my numbers were. I actually clicked
and dragged through them to put that into the formula.
The functions I used were
 AVERAGE(x1,x2,...)
 STDEV(x1,x2,...)
 COUNT(x1,x2,...)
 NORMSDIST(z)  = 1 sided cumulative area under normal where z has sigma=1
(By the way, if anyone wants any help making plots or whatever in
Excel or with other tools, come find me.)
summary
So my working hypothesis is that six dice rolled in a glass jar do not
give a good measure of the probability of these crooked dice as
rolled in normal circumstances. It'd take more time than I have now
to evaluate that properly.
At least the data this year from rolling in the toolbox and last
year's data are consistent. Combining the two with weighted averages
gives me a best estimate of p(1)=p(6)=0.203 with sigma=0.013 .
craps
Now - craps. The rules look like this:
- 1st roll :
- 7 or 11 wins
- 2, 3, or 12 loses
- 4, 5, 6, 8, 9, 10 sets the "point"
- successive rolls (if point is set)
- point wins
- 7 loses
- any other number means keep going.
I wrote a short computer program to report the odds of winning with
these dice. The results are a bit counter-intuitive: you actually win
less often with the loaded dice.
 probability of winning with honest dice = 0.493
 probability of winning with p(1)=p(6)=0.203 dice = 0.471
The reason behind this is that while the dice increase the odds of
your winning on the first throw (because 7 and 11 are more likely),
most of the time you *don't* win on the first throw; instead you have
to make your point. This is true both with the honest dice
(probability of continuing = 0.667) and the crooked dice (probability
of continuing = 0.626). And once you have to make your point, the
first 7 loses - which is more likely with the crooked dice.
The details are at the end of the
craps.pl file.
in conclusion
The upshot of all this is that getting the right answer
even in a fairly simple (one might even say contrived) case like this
isn't all that easy, either in terms of the repetitive dice rolling
you need (thousands of dice rolls - not all that
different from a lot of the tedious science I've done, actually)
or in terms of the math you may well need to get your point across (ditto).
FYI, I spent about an hour rolling dice, and about three hours
thinking about what I had, doing the calculations and plot in Excel,
analysing the craps game, writing it all up, and putting it online.
Your mileage may vary.
So there you are.