Jim's suggested procedure
We have six dice. We'd like to measure the probability of rolling a one or six.
If the dice were fair, we'd expect that result to be 1/3 ... but we want to
actually measure experimentally whether it is or not, and describe how confident we are.
While this particular question isn't exactly world shaking, the issues involved
and the way that we want you to present the results are typical of any experimental measurement.
Below is a description of the sort of experiment I have in mind.
This could be done with either crooked dice or (as a control) fair dice.
This recipe isn't set in stone; I'm just trying to give you an idea of how to go
about measuring what the dice are doing.
Please do make sure you understand what's going on here; just following a recipe blindly can get you into trouble. If anything isn't clear, ask. To do the actual calculations you can use a calculator or a software tool like excel, mathematica, or an online statistics package. To make the plot with error bars you can use pencil and paper, excel, mathematica, or anything else you're familiar with.
the recipe
- Roll six dice and count how many 1's and 6's you get. For example, if you don't get any, write down "0"; if they're all 1's or 6's, write down "6".
- Repeat this N times. (How big is N? Up to you...) You now have a list of N numbers as your raw data.
- Divide these by 6 to turn them into probabilities.
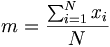
- Find the mean ("m") of the probabilities; that's your measured probability.
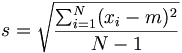
- Find the estimated standard deviation ("s") of the parent population. This represents the typical distance of a single data point from your mean value. If they're normally distributed, about a two thirds of the data should be within "s" of the mean. About 95% should be within twice s of the mean.
- Now estimate the error in your measurement of the mean by calculating "s/sqrt(N)"; this is how far off you'd expect to be if you (or someone else) did the whole N measurements again to find another estimate of the true value.
- Your measured result is "mean +- 2 s/sqrt(N)". (The factor of 2 gives you "95% confidence" limits, which is the minimum typically accepted for a scientific paper.)
formula summary
a data point (probability = number of 1's and 6's rolled with six dice / 6 ):

number of data points :

mean :
estimated standard deviation of one data point from the mean :
sigma of mean :

measured result :

discussion
With your results and certainty in hand, are your dice fair?