
Learning to program is getting harder | discussion
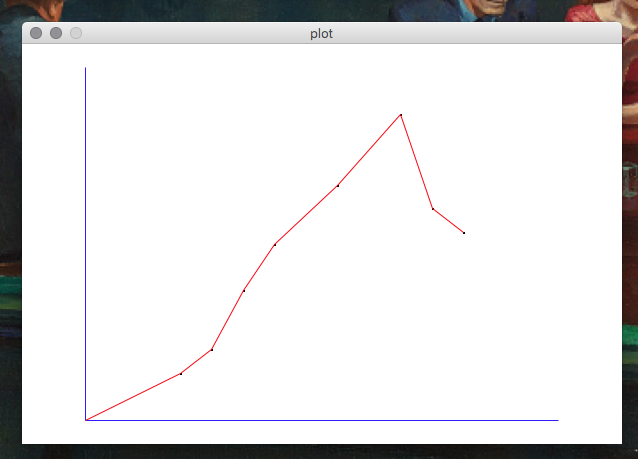
We worked though this python code, which draws the plot below.
"""
 plot.py

 An example of using Zelle's graphics library
 to draw a plot of data from a file.

 In class example, Mon Feb 19.

 Jim Mahoney
"""
from graphics import *

def get_data(filename):
    """ Return two arrays of numbers given a filename.
        The file should have comma seperated columns, i.e.
           1, 2.2
           2, 5.1
           3, 10.7
        The last line should *not* have a newline:
        each line must have a number, a comma, and a number
    """
    x = []
    y = []
    for line in open(filename).readlines():
        words = line.split(',')
        #print " words = ", words
        new_x = float(words[0])
        #print " words[0] = ", words[0]
        #print " new_x = ", new_x
        x = x + [new_x]
        new_y = float(words[1])
        #print " words[1] = ", words[1]
        #print " new_y = ", new_y
        y = y + [new_y]
    return (x, y)

def plot_points():
    """ Get data & plot 'em ! """
    # output             input
    (x, y)    = get_data("data.txt")
    window = GraphWin("plot", 600, 400)

    # We looked at the data, and picked
    # values for smallest & largest that looked OK.
    #                xll yll  xur yur    low_left up_right
    window.setCoords(-2, -10, 17, 160)

    # x axis
    xaxis = Line(Point(0,0), Point(15,0))
    xaxis.setFill('blue')
    xaxis.draw(window)

    # y axis
    yaxis = Line(Point(0,0), Point(0,150))
    yaxis.setFill('blue')
    yaxis.draw(window)

    # points
    last_p = Point(0, 0)
    for i in range(len(x)):
        # We tried this with circles ...
        # but they looked lopsided since
        # the coordinates were different.
        #
        # So now I'm doing dots
        # and playing "connect the dots".

        p = Point(x[i], y[i])
        p.setFill('black')
        p.draw(window)

        the_line = Line(last_p, p)
        the_line.setFill('red')
        the_line.draw(window)

        last_p = p

plot_points()
done = raw_input("Done? ")
![[paper clip]](/cours/static/images/paper_clip_tilt.png)
| last modified | size | ||
| data.txt | Wed Jun 24 2026 12:43 am | 53B | |
| graphics.py | Wed Jun 24 2026 12:43 am | 32K | |
| plot.py | Wed Jun 24 2026 12:43 am | 2.0K | |
| screenshot.png | Wed Jun 24 2026 12:43 am | 101K |