dice and statistics
This lab looks at some ideas from statistics
using dice. Why dice? Well, it's easy to generate
lots of data and they can be sometimes a bit trickier
than you expect - especially when some of them are loaded. (Yes, loaded.)
Background reading
- If you've ever done any statistics, review that and remind yourself how it works.
- Browse the wikipedia articles listed at the bottom of this page. Follow and browse any of the links that look interesting.
- Be ready to talk about any of it in class.
Mon Feb 11
3:00 - 3:30 or so
Travis goes over the random walk simulation (coin flips) from last time. The excel file is
travis_histrogram.xls
3:30 - 4:00
Jim presents some ideas from statistics.
- Jim's Basic Statistics notes (from Spring 2006)
- mean, standard deviation, normal curve
- formula, intuition, pictures, and std_dev with (n) vs (n-1)
- std_dev(mean of n trials) = std_dev(once)/sqrt(n)
- plugging in the numbers : excel or a calculator
- Here's what Jim did in class.
4:00 - 4:30
Presentation of the question you're going to answer for next week.
For next week
- During the next week, we'd like you to do a better job atanswering these questions. In fact, Jim will give the personwith the best answers a fancy chocolate bar.
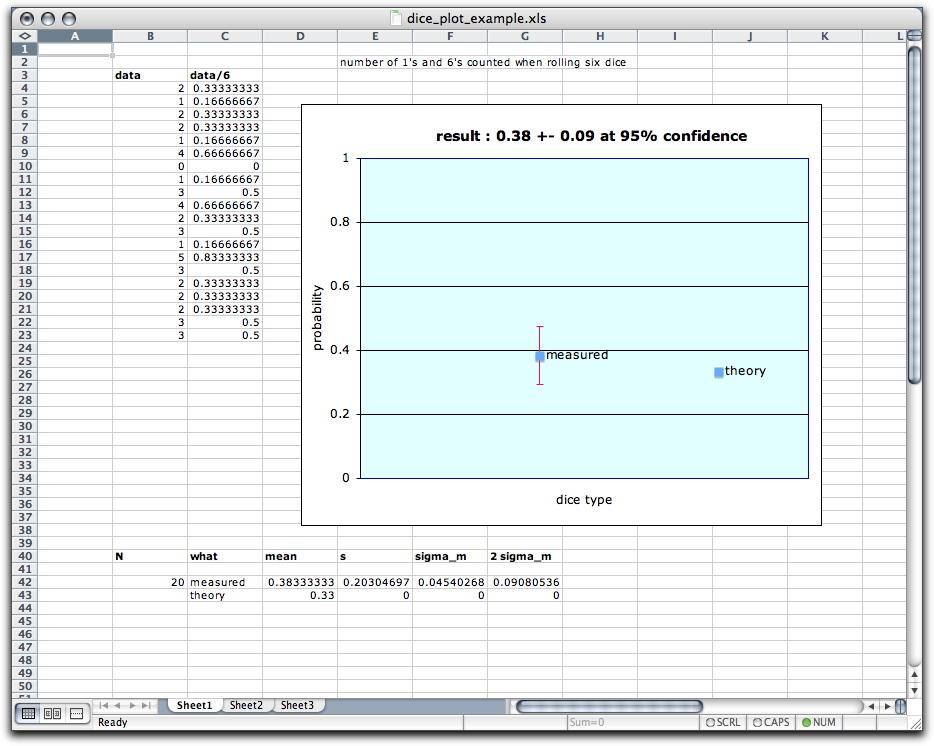
- So: come to class with a measurement in hand (i.e. I've measured *** to be *** +- ***) and a picture (i.e. a point with error bars) comparing that to typical dice.
- For next week's class, we'll share our results.
Feb 19
Other Resources
- wikipedia on statistics
- wikipedia on craps
- other
