2012-02-01
Started working on code to show Zipf's law graphically.
- (pg12.txt = Through the Looking Glass [Carroll])
- (pg2701.txt = Moby Dick [Melville])
- Graph: "Through the Looking Glass"
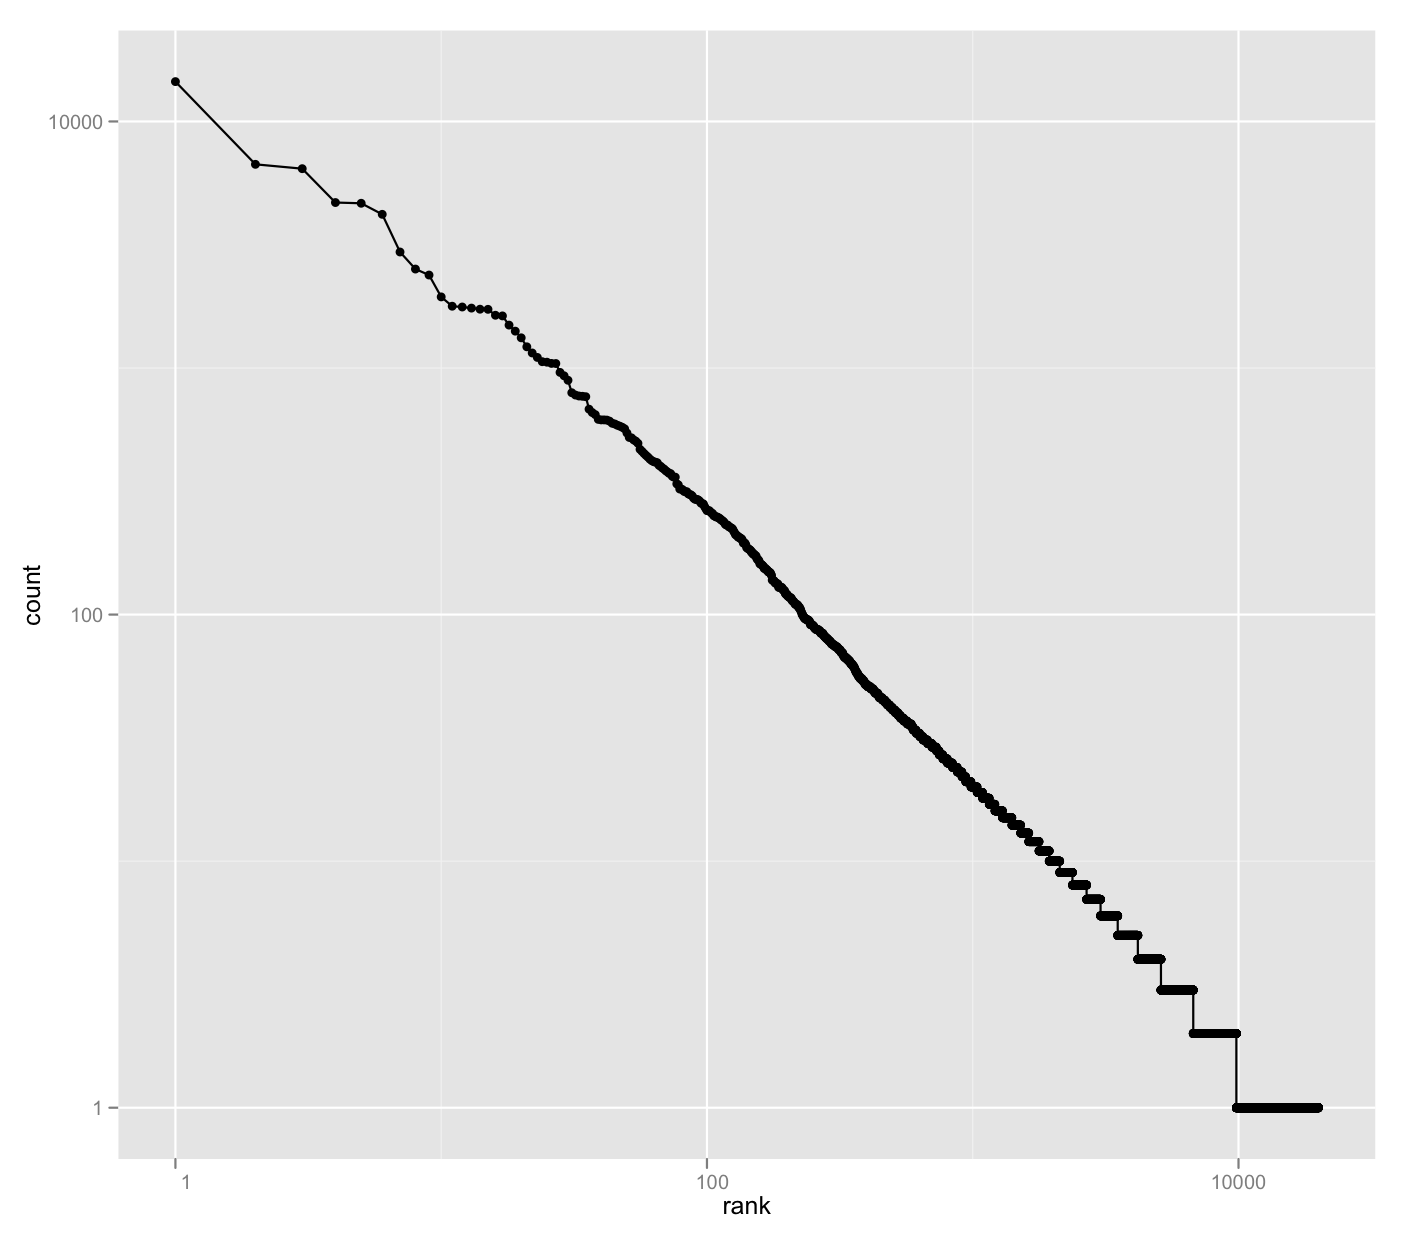
- Graph: "Moby Dick"
data = read.csv("mobydick.csv")
count=data$count
rank=data$rank
library(ggplot2)
qplot(count, rank, data=data, log="xy") + geom_line()
The difference between corpocc.py and rcorpocc.py is that rcorpocc.py outputs in comma separated values (.csv).
Reading

![[paper clip]](/courses/source/wiki_images/paper_clip_tilt.png)